Restaurants Expected to Rebound after October Slump

RestaurantIndustry.jpeg


After disappointing restaurant sales in October, momentum was regained as same-store sales growth returned to positive territory during November. Although the 0.5 percent sales growth experienced in November can be considered relatively modest, especially compared with the average 2.2 percent same-store sales growth reported for the first nine months of the year, the 0.6 percent upward swing compared with the -0.2 percent same-store sales growth reported for October is encouraging. This improvement from last month’s year-over-year sales growth rate is the largest reported by the industry since June 2015. This insight comes from data reported by TDn2K’s Black Box Intelligence through The Restaurant Industry Snapshot, based on weekly sales from over 22,000 restaurant units, 120-plus brands, representing $55 billion dollars in annual revenue.

“At a national level, many of the key economic indicators are still positive. Job growth is expected to be reported as strong for November, unemployment is still slowly declining and consumer sentiment continues to be relatively strong compared with previous years. It is not surprising that the restaurant industry was able to rebound and post positive same-store sales growth during November, albeit small, especially when factoring the effect of increasing average guest checks,” says Victor Fernandez, executive director of insights and knowledge for TDn2K. “However, it is difficult to be too optimistic for the fourth quarter, given the declining trend in same-store sales growth we have been reporting on throughout the year. Growth continues to be positive, but we are definitely experiencing a slowdown in restaurant sales.”

At the end of November, quarter-to-date same-store sales growth is 0.2 percent; a big drop from the 1.5 percent posted during the third quarter. Year-to-date same-store sales growth is now 1.8 percent as we head into the last month of the year.

There is favorable news for the industry observed in the increase of same-store sales during November as a result of an improvement in traffic and not because of companies increasing their prices. Same-store traffic growth was -1.7 percent during November, a significant 1.1 percent improvement over the -2.8 percent reported for October. “However the chain restaurant industry as a whole continues to have a chronic traffic problem,” Fernandez says, “and it has worsened during the last couple of months. The average same-store traffic growth for October and November was -2.2 percent, compared with an average -1.1 percent for the first nine months of the year.”

The steady drop in average guest check growth is a key component in the slowdown in sales experienced since July. While the average guest check growth in comparable stores during the first six months of the year was 3.4 percent, the average for the five months since then was only 2.5 percent. Furthermore, the 2.0 percent growth posted in November is the lowest year-over-year increase in average guest check reported by the industry since June 2014. A factor behind this decrease in average guest check growth seems to be a decline in same-store beverage sales, which have reported negative growth during the last three quarters while food sales growth has been able to remain positive.

As has been the case during most of this year, the segments in limited service (quick service and fast casual) were the top performers based on same-store sales growth during November, significantly outpacing the sales growth of the full service segments of the industry.

Although at the regional level there are significant differences in sales growth performances, the slowdown in sales has been widespread and affected all regions of the country. The average same-store sales growth for October and November combined was lower than the average for the three previous months in all 11 regions of the country tracked by Black Box Intelligence. The best performing region was California for the fourth consecutive month, with same-store sales growth of 2.9 percent and -0.2 percent traffic growth during November. The worst performing region for the third consecutive month was the Southwest (Louisiana, Arkansas, Oklahoma, and New Mexico), which posted -3.3 percent same-store sales growth and -4.6 percent for traffic. The impact of the energy industry downturn seems to continue to be a factor in oil producing states, since in addition to the slump in the Southwest, the Texas region was one of the only three that experienced negative sales growth during November and has now endured three consecutive months of same-store sales growth.

From a market perspective, 103 (53 percent) out of the 193 DMAs tracked by Black Box Intelligence reported positive same-store sales growth during November. Although an improvement from the 42 percent of DMAs that posted positive growth during October, this represents a considerable decline from the average 71 percent of DMAs that had positive sales growth during the June through September period.

As restaurant sales dropped in October, so did the number of new jobs created by the restaurant industry according to TDn2K’s People Report latest reports. Jobs in restaurants grew by 3.9 percent year-over-year during October; while the average growth rate for the previous three months was 4.6 percent. Even with this slowdown in October, the chain restaurant industry continues to consistently outpace the rest of the economy when it comes to job creation. As a comparison, the average year-over-year growth rate in total number of non-farm jobs was only 2.0 percent during the September through October period. The restaurant industry is creating jobs at more than twice that rate.

The pressures of the tightening labor market continue to be felt by restaurants in the form of rising turnover levels. After three months of flat restaurant management turnover rates, rolling 12 month turnover started climbing again and now has increased during eight of the last 12 months ending in October. Meanwhile, restaurant hourly turnover remains in its upward trend that started back in September of 2013. Rolling 12-month hourly employee turnover in restaurants has increased during 26 consecutive months. Staffing and retention has become a major concern for operators and expectations are for continued challenges in this area in months to come.

According to TDn2K’s White Box Social Intelligence based on a sample of almost 8.5 million online mentions, guest sentiment towards chain restaurants became more positive during November compared with previous months. Out of three key guest satisfaction indicators tracked in the Restaurant Industry Snapshot (“food”, “service,” and “intent to return”), all showed a higher percentage of positive sentiment mentions than in any of the previous seven months. Tied to this increased positive sentiment seems to be the buzz around holiday events and promotions that started to take over the social chatter for restaurants in November.

The top-performing segment during November based on percentage of positive mentions for all three guest-satisfaction attributes was fine dining (this segment was also the top performer for “service” and “intent to return” the previous month). This might also be tied to holiday events planned for and promoted by the brands in this segment. However, nearly all industry segments saw an increase in their positive-sentiment conversations during November, providing some encouraging news for the industry as we head into the last month of the year.

The Restaurant Industry Snapshot is a compilation of real sales and traffic results from over 193 DMAs representing 120-plus restaurant brands and over 22,000 units that are clients of Black Box Intelligence, a TDn2K company. Data is reported in six distinct segments: quick service, fast casual, family dining, casual dining, upscale casual, and fine dining. TDn2K is also the parent company to People Report and White Box Social Intelligence. People Report tracks the workforce analytics of one million restaurant employees. White Box Social Intelligence delivers consumer insights and reveals online brand health in relation to operational metrics. TDn2K reports on over 32,000 restaurant units, 1 million employees and $55 billion dollars in sales.

(via QSR Magazine)


Restaurant Performance Index Rose in October

busy-restaurant-kitchen-imspirational-ideas-on-kitchen-photo.jpg


Driven by stronger same-store sales and a more optimistic outlook among restaurant operators, the National Restaurant Association’s Restaurant Performance Index posted a moderate gain in October. The RPI—a monthly composite index that tracks the health of and outlook for the U.S. restaurant industry—stood at 102.1 in October, up 0.7 percent from a level of 101.4 in September. In addition, October represented the 32nd consecutive month in which the RPI stood above 100, which signifies expansion in the index of key industry indicators.

“The October gain in the RPI was buoyed by broad-based improvements in the current situation indicators,” says Hudson Riehle, senior vice president of the Research and Knowledge Group for the Association. “In addition, restaurant operators are somewhat more optimistic about both sales growth and the economy in the months ahead.”

The RPI is constructed so that the health of the restaurant industry is measured in relation to a steady-state level of 100. Index values above 100 indicate that key industry indicators are in a period of expansion, while index values below 100 represent a period of contraction for key industry indicators. The Index consists of two components—the Current Situation Index and the Expectations Index.

The Current Situation Index, which measures current trends in four industry indicators (same-store sales, traffic, labor, and capital expenditures), stood at 102.5 in October—up 1.2 percent from September and the highest level in three months. In addition, the Current Situation Index remained above 100 for the 20th consecutive month, which signifies expansion in the current situation indicators.

A majority of restaurant operators reported higher same-store sales for the 20th consecutive month, with October’s results representing the strongest performance since July. Sixty-one percent of restaurant operators reported a same-store sales gain between October 2014 and October 2015, up from 51 percent who reported higher sales in September. In comparison, 22 percent of operators reported a same-store sales decline in October, down from 27 percent in September.

While sales levels improved in October, the customer traffic results were similar to the August and September readings. Forty-one percent of restaurant operators reported an increase in customer traffic between October 2014 and October 2015, down slightly from 42 percent in September. Thirty-six percent of operators said their traffic declined in October, compared to 38 percent in September.

Restaurant operators also continued to report healthy capital spending activity in October. Seventy-six percent of operators said they made a capital expenditure for equipment, expansion or remodeling during the last three months, which marked the 13th consecutive month in which a majority of operators reported making an expenditure.

The Expectations Index, which measures restaurant operators’ six-month outlook for four industry indicators (same-store sales, employees, capital expenditures, and business conditions), stood at 101.6 in October—up slightly from a level of 101.4 in September. October represented the 36th consecutive month in which the Expectations Index stood above 100, which indicates restaurant operators remain generally optimistic about business conditions in the coming months.

Restaurant operators reversed a downward trending sales outlook with somewhat more optimistic expectations. Forty percent of restaurant operators expect to have higher sales in six months (compared to the same period in the previous year), up from 35 percent who reported similarly last month. Meanwhile, only 6 percent of restaurant operators expect their sales volume in six months to be lower than it was during the same period in the previous year, down from 12 percent last month.

Similarly, restaurant operators are somewhat more optimistic about the direction of the overall economy. Nineteen percent of restaurant operators said they expect economic conditions to improve in six months, while only 9 percent expect conditions to worsen. This represented the strongest net positive reading in five months.

Looking forward, a majority of restaurant operators said they are planning for capital expenditures in the months ahead. Fifty-nine percent of restaurant operators plan to make a capital expenditure for equipment, expansion or remodeling in the next six months, down slightly from 62 percent who reported similarly last month.

(via FSR Magazine)


Economic Considerations of Eliminating Tips (Infographic)

Tipping03.jpg


Is the U.S. restaurant tipping model on its way out? Amid concerns over whether compensation for back-of-the-house and front-of-the-house employees is fair and how the push for raising minimum wage will impact cost-cutting measures, the tip reform movement is stirring up controversy. Earlier this month, Danny Meyer, CEO of Union Square Hospitality Group, made waves in the industry when he called tipping a “broken system” and announced that his restaurants would phase out tipping by January. The pros and cons of this consideration have impact from the board room to the dining room, and servers, cooks, owners and customers have a stake.

But what about the economic impact? Reporting tips for tax purposes is one of the most complex requirements for restaurants and their employees. Here is a look at the potential effects of eliminating tipping:

Owners Adjust for Higher Wages, Lose the Tip Tax Credit

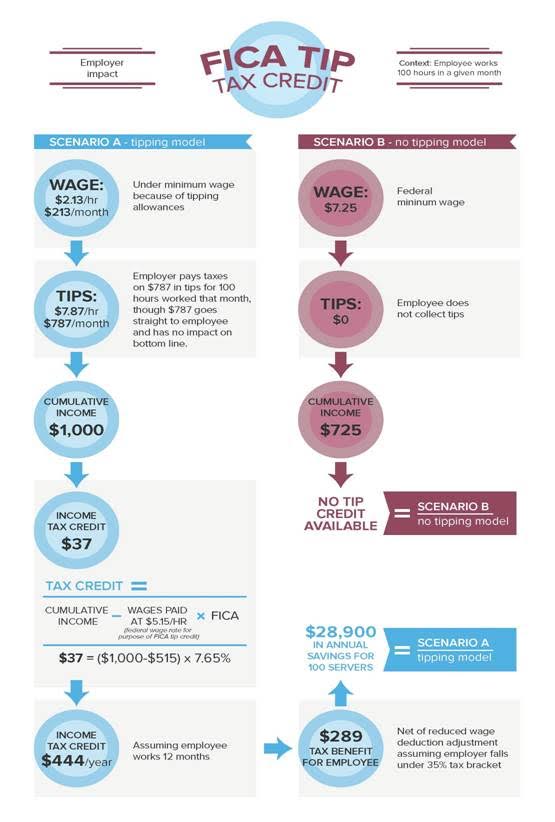
Federal law allows restaurants to pay servers $2.13 per hour with the server’s tips expected to meet or exceed federal minimum wage requirements. Some states — like New York which will have a $15 minimum wage for fast food workers in 2016 —require a higher minimum wage. Additionally, there is a federal income tax credit (IRC 45B) that the restaurant can take for all tips reported by the server in excess of $5.15 per hour. This gives the restaurant an incentive for encouraging their employees to report all their tips. In a non-tipping environment, restaurants would have to pay higher wages and higher employment taxes, but would have a larger deduction for the increased wages and payroll taxes.

The federal FICA tip credit has been a significant benefit for a number of restaurants over the years. Restaurants that are considering changing to a no-tipping policy may be giving up a substantial tax benefit, and need to take that into account when setting menu prices or additional service charges to help finance the increase in non-tipped wages.

Some fine dining establishments who have eliminated tipping have added a service, hospitality or administrative charge, while others have raised menu prices to compensate. It's important to note that service charges do not constitute tips for the purposes of the federal FICA tip credit.

Employees gain predictability, but not guaranteed higher earnings

Servers are required by law to report all tips, but the IRS has suggested that as much as 40 percent of restaurant tips are not reported. If this is true, many employees are paying less income and employment tax than they should in a tipped environment. In a non-tipped establishment, employees receive wages which may or may not be as much as they earn in a tipping situation. Ideally, the non-tipped wage would create more predictability in employees’ income, eliminating the uncertainty associated with fluctuating tips from shift to shift. However, some will do better and some worse under a no-tipping model. Bonuses may be necessary to retain servers.

Calculation: Let’s take a look at a simple example of how the FICA tip tax credit works.

It remains to be seen whether the tip elimination trend will be a mere crest or a tidal wave of change in the restaurant industry. It is clear, however, that the business impact could be substantial, and restaurants would need to adapt practices accordingly. Even if restaurants and employees can thrive on a no-tipping model, how will customers react? Stay tuned to our blog in the weeks ahead as we explore the potential implications for players throughout the industry.

(via Fast Casual)


Danny Meyer's Hospitality Included Program Begins

TheModern01.jpg


In early October, Danny Meyer took the restaurant and hospitality industry by surprise, and announced that he would be getting rid of tips at all of his Union Square Hospitality Group's restaurants, such as, Union Square Cafe, Gramercy Tavern, Blue Smoke and more.

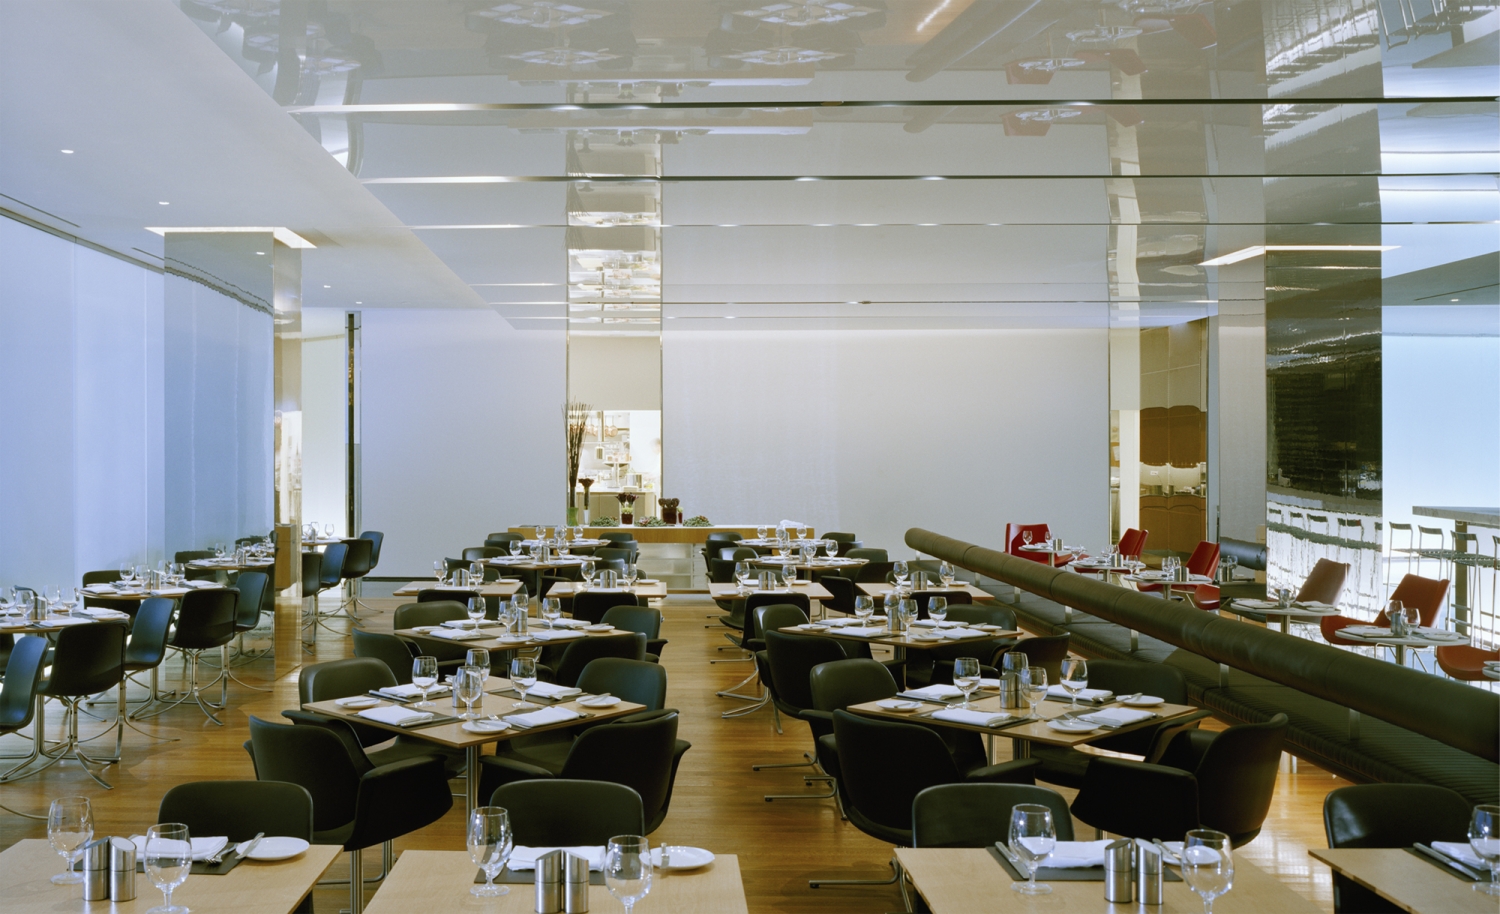
Today, his initiative will officially go into effect. The first restaurant to undergo the change is The Modern, located within the Museum of Modern Art in Midtown, New York City. Meyer hopes to stop accepting tips at the rest of his eateries by the end of next year.

Diners will expect to see increased prices on the menu. For example, lobster sausage, previously priced at $33, will now cost $44. However, customers in actuality won't be paying any more than before, because they no longer will be paying an additional tip. (The menus at The Modern have already been updated with the note: "The Modern is a non-tipping restaurant. Hospitality Included.")

Tipping has always been a hot button issue in the industry, but lately, the tide seems to have shifted towards being tip-free. Joe Crab Shack, a national chain, recently began testing no tipping at 18 of their restaurants. Others that have adopted the gratuity-free policy include, Per Se in New York City, Chez Panisse in Berkeley, Bar Marco in Pittsburgh, and Alinea in Chicago.

The practice has also been picking up in pace due to the growing demands of restaurant workers, especially, back-of-house staff. By dropping tipping, wages potentially will be more evened out across all employees.

Meyer stated in an interview: "We believe hospitality is a team sport, and that it takes an entire team to provide you with the experiences you have come to expect from us. Unfortunately, many of our colleagues—our cooks, reservationists and dishwashers to name a few—aren't able to share in our guests' generosity, even though their contributions are just as vital to the outcome of your experience at one of our restaurants."

See: Danny Meyer Eliminates Tipping from USHG’s Restaurants

(via Zagat)


 Looking to work in Hospitality?

Discover who’s hiring on Harri


Follow Harri on Facebook and Twitter

for real time job posts and industry news.


Increased Holiday Hiring For Chefs

ChefJob01.jpg


CARLSBAD, Calif., Nov. 11, 2015 /PRNewswire/ -- The holiday season brings a temporary employment boost every autumn, and 2015 is no exception. In fact, the outlook for seasonal hiring this year is already favorable, says a new CareerCast report. Whether you're unemployed and seeking a full-time job or just looking to earn some extra spending money over the holidays, now is a good time to apply for one of the many seasonal jobs available. Jobs needed to meet the holiday rush include customer service representatives, parcel deliverers, retail sales and distribution warehouse staff.

Many of CareerCast.com's best seasonal jobs are tied into traditional customer service and retail but restaurants also become busier as they meet the demand for office holiday parties and refuel shoppers.

Retailers are expected to add about 755,000 jobs to their payrolls from October through December, according to Challenger, Gray & Christmas. Online retailer Amazon intends to hire 100,000 seasonal employees this year. While Americans increasingly shift their shopping focus to online distribution, traditional brick-and-mortar business still need extra hands at the holidays. Retail salespersons are always in demand this time of year. And, with Amazon, the largest online retailer bulking up for process of orders, people are needed to help handle the influx of deliveries.

Parcel deliverer is a great holiday job with plenty of opportunities. Industry-leader UPS expects to hire 90,000 employees in the next two weeks. In line with Amazon, that's an increase over recent years' employment.

Retail and food service are obvious cornerstones of holiday employment, but this time of year is a boon for entertainers, as well. We all grew up with Santa Clauses at malls, department stores and pop-up outlets, but the traditional Santa Claus is just one in-demand performer at the holiday season.

And, as many seasonal job-seekers pursue long-term employment at the end of the holiday season, part-time gigs can turn into more opportunities for the future.  But whether your goal in finding seasonal employment is a longer term deal, or just the chance to make some additional spending money, know what is expected of you up front.  Holiday jobs don't always end on Dec 24. Many continue beyond throughout the return and price-cut season.

The following are some of the best options for seasonal employment in 2015:

  • CHEF
  • CUSTOMER SERVICE REPRESENTATIVE
  • MATERIAL MOVING MACHINE OPERATOR
  • MATERIAL RECORDING CLERK
  • PARCEL DELIVERER
  • PERFORMER
  • PHOTOGRAPHER
  • RETAIL SALESPERSON

To see the full report, visit http://www.careercast.com/jobs-rated/demand-seasonal-jobs-2015

About CareerCast.com CareerCast.com, created by Adicio, is a job search portal that offers extensive local, niche and national job listings from acrossNorth America; job-hunting, career-management and HR-focused editorial content; videos and blogs; and provides recruiters with the ability to post jobs directly to more than 800 niche career sites. CareerCast.com also compiles the Jobs Rated Report (www.jobsrated.com), where 200 jobs across North America are ranked based on detailed analysis of specific careers factors.

(via PR Newswire)